Chicago Summer Violence Analysis
A detailed overview of my Chicago Summer Violence Dashboard, highlighting its key features, data sources, and practical applications for enhancing public safety in Chicago. Estimated Read Time: 6 minutes

Tableau Conference 2021 Blog in Partnership with Slalom
Check out this blog I wrote in partnership with Slalom Consulting and a colleague of mine at the company. Hopefully TC22 will return to in person so we can truly experience a TC event! https://www.slalom.com/insight/data-viz-trends-2022

Lessons learned from Tufte: Sparklines and datawords
This mini-blog series will explore real-world examples of my interpretation and inclusion of design theories and examples from Edward Tufte. In this post, I explore a familiar topic of combining text, numbers, and data lines into large-scale visualization
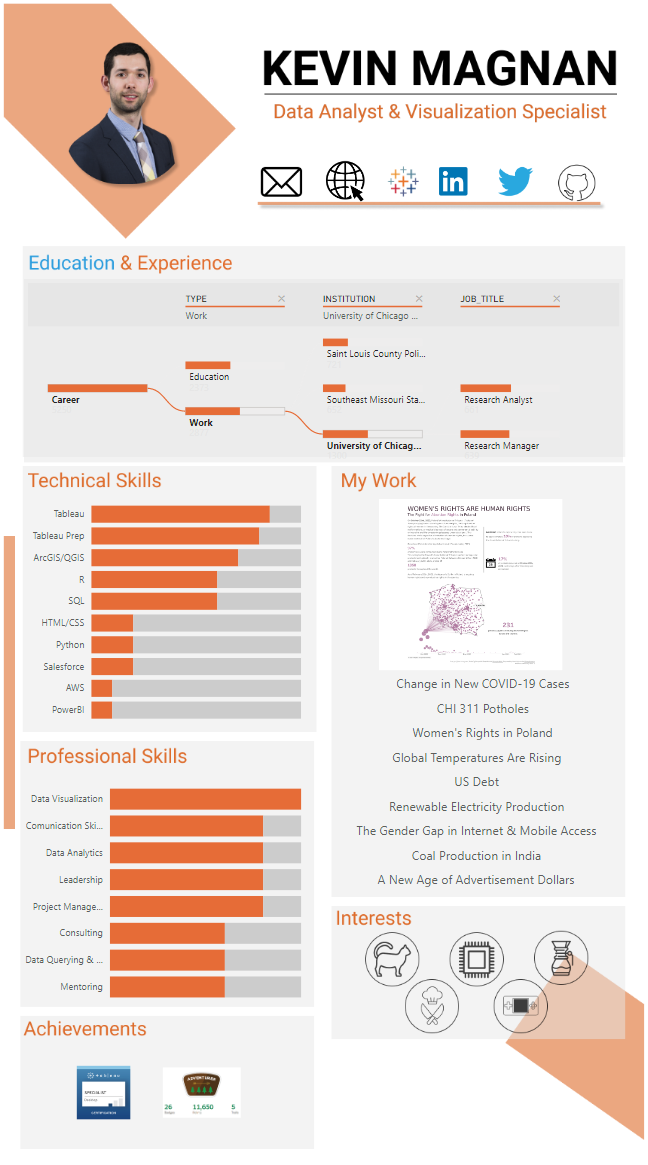
Tableau Interactive Resume
A walkthrough on building an interactive resume to show your Tableau skills and also serve as a comprehensive resume of your skills, experience, and background.
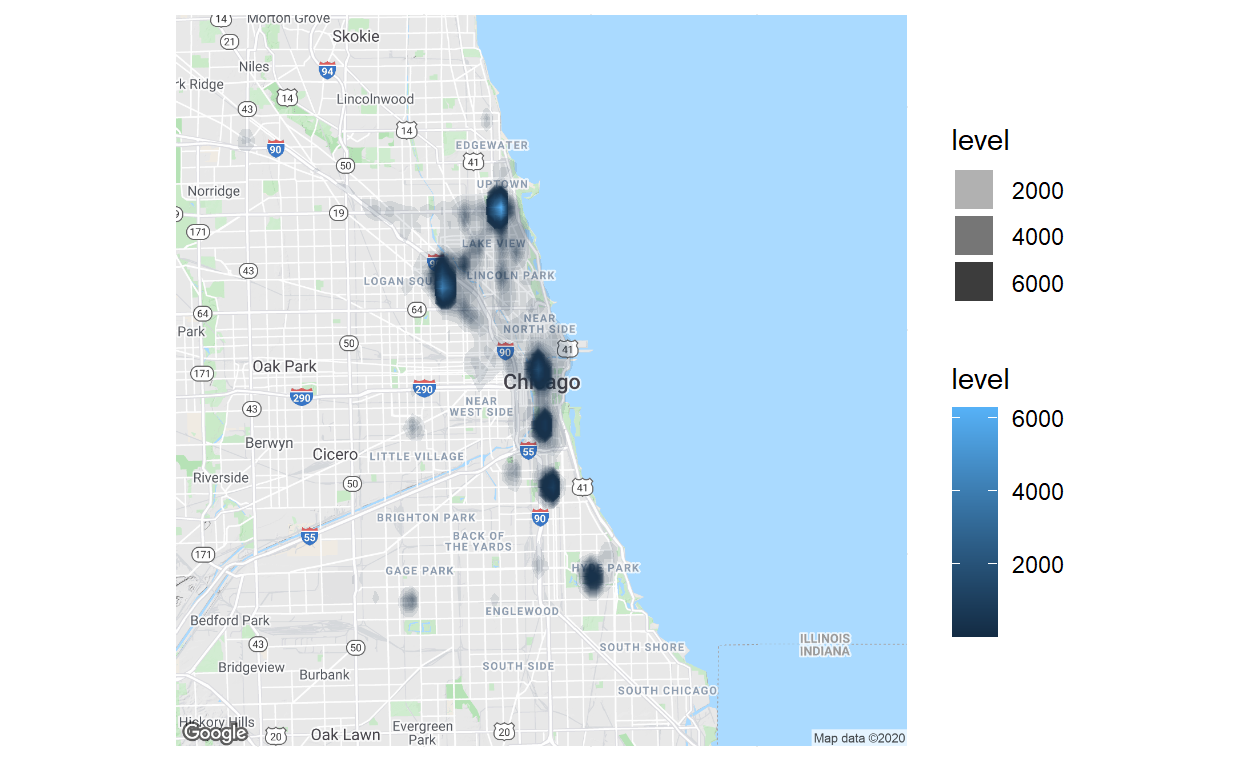
Google Takeout
Analyzing My Google Search and Map History with Google Takeout service
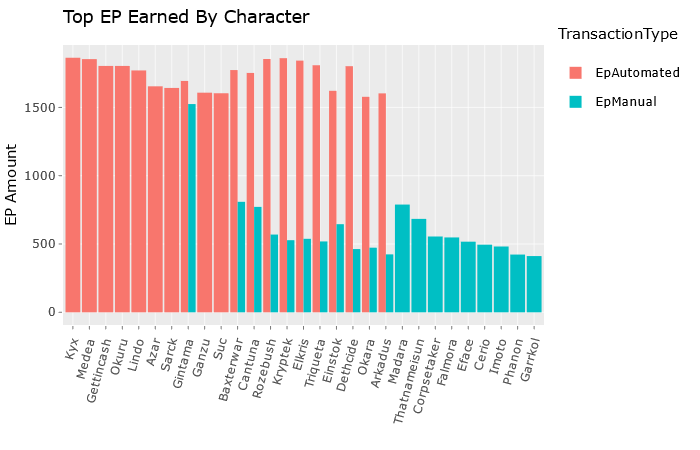
WoW Buzz Analysis
Analysis of My World of Warcraft Classic Guild Loot System Data

Your Mom's House Analysis, Part II
Part II of a II part analysis of YMH YouTube transcription data

Your Mom's House Analysis, Part I
Part I of a II part analysis of YMH YouTube transcription data
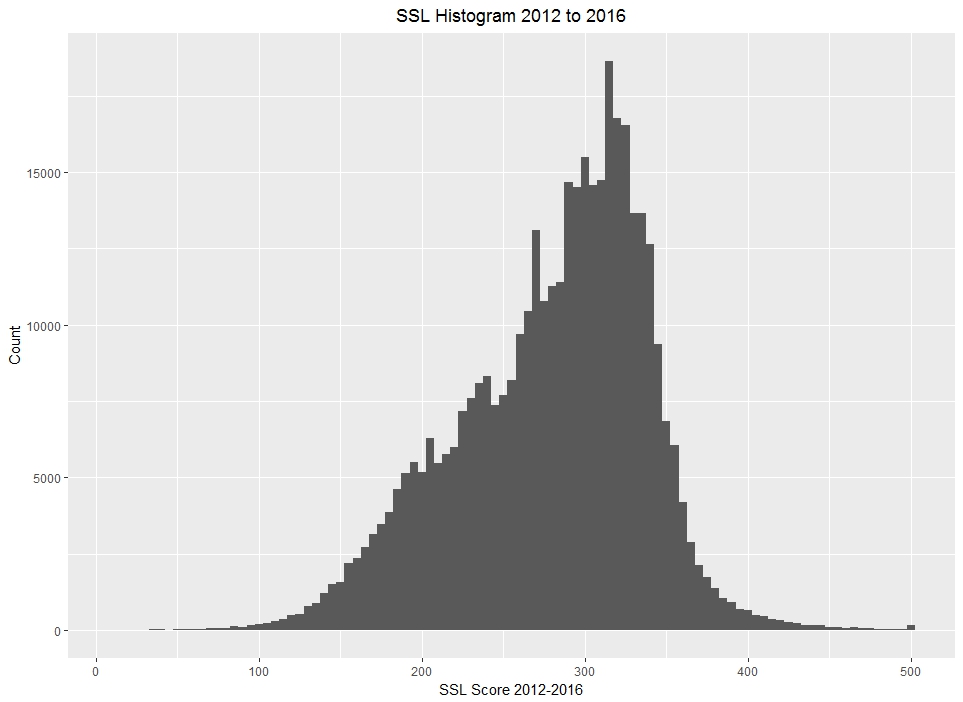
Chicago SSL Scores
Exploratory Analysis of Chicago Police Department's SSL Scores

Mapping with GeoDa
Exploratory Analysis of Census, Crime, and Call for Service data in Chicago