Exploratory Analysis
Chicago has historically been a segregated city and continues to be segregated in 2017. While the population of Chicago is roughly split into thirds for blacks, Hispanics, and whites, these populations, similar to crime rates, are not spatially distributed evenly within the city according to census data. These three populations display near perfect segregation, with black populations concentrated in the south and west communities, Hispanics concentrated in the northwest and southwest communities, and whites concentrated in the northern communities.
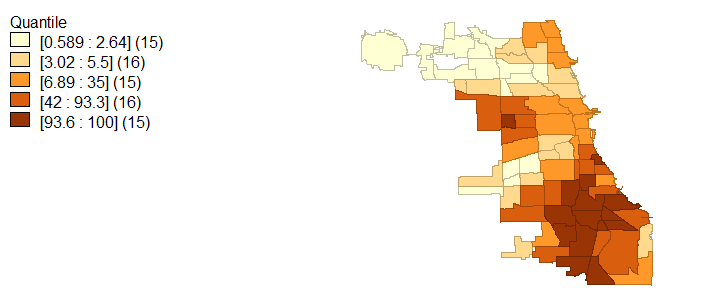
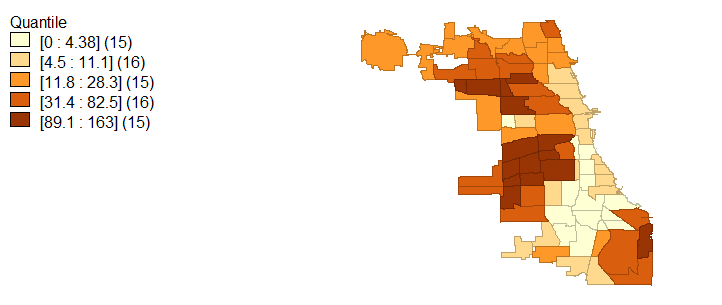
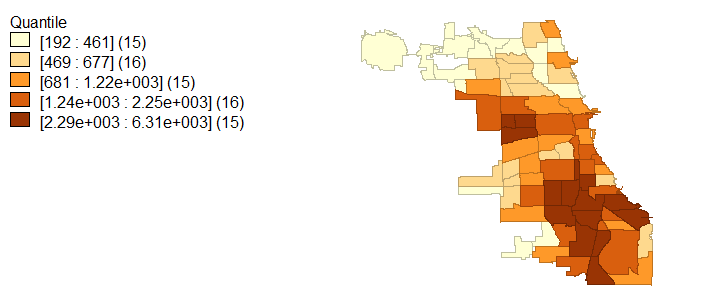
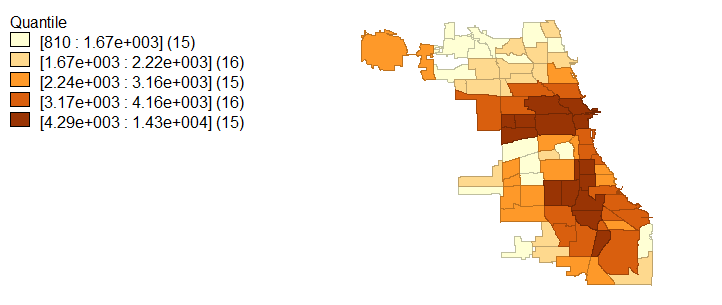
Racial demographics are not the only characteristic that exhibits spatial variability; in light of racial segregation, educational attainment and average household income also fall in line with a socioeconomic segregation narrative. Figures 4, 5, and 6 visualize the extremes to which Chicago is segregated economically and with educational attainment. Specifically, higher household incomes are located in the same regions which are occupied by majority whites while lower household incomes are associated with black and Hispanic populations. These same economic disconnects are seen in age 25 and older population educational attainment.

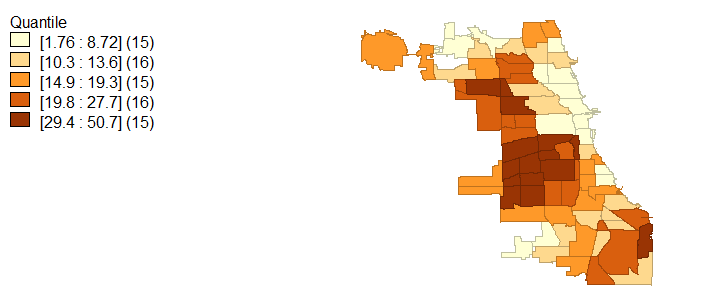

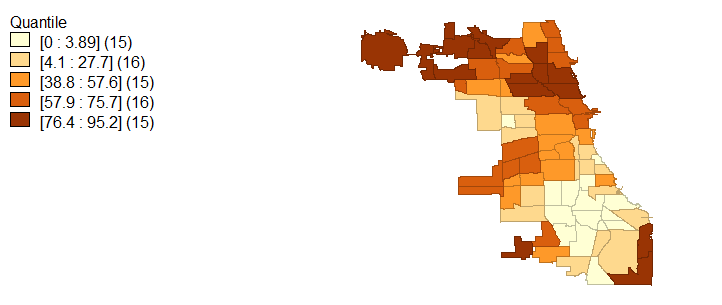
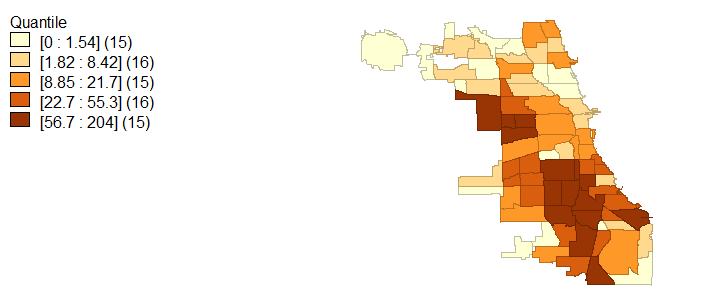
Finally, as was alluded to by the University of Chicago Crime Lab’s Gun Violence report as well as the Chicago Police Department and numerous Chicago media outlets, Chicago crime is disproportionately concentrated in these areas of high black and Hispanic populations with low educational attainment and low incomes. Violent crime rates in figure 7 and homicide rates in figure 9 bring further evidence to the claim that Chicago’s violent crimes and murders occur in primarily black and Hispanic neighborhoods with low income and education. Property crimes, in figure 8, tell a slightly different story since these crimes are more prolific in areas with more wealth and property value, like Chicago’s Loop area.
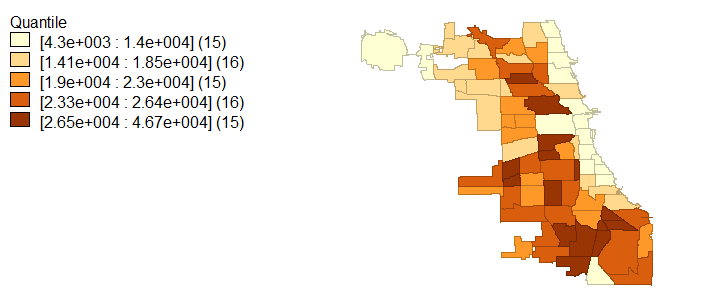
311 call rates, represented in figure 10, present a different narrative than one would imagine in the context of Chicago’s crime rates and population demographics. As far as what can be taken at face value from these figures, there does not appear to be any patterns or clusters of 311 call rates in an area. If communities were to have high collective efficacy and be proactive in keeping their neighborhood in order, then we would expect the areas with either high violent and high property crimes or low violent and property crimes to be calling the city of Chicago at the highest rates. Instead, we see a dispersed rate of 311 calls incongruent to property crime locations and only partially reflective of violent crimes and homicides.
Spatial Analysis
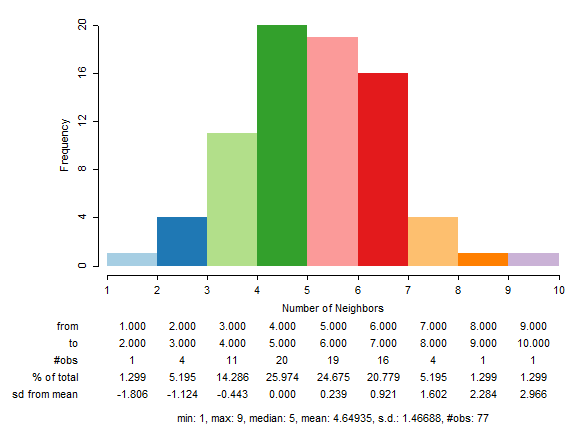
In the exploratory analysis, I utilized quantile maps to visually investigate whether certain community area characteristics were clustering in specific areas of the city. To create a more scientific determination of clustering, I conducted global and local Moran I and Local Getis-Ord Gi* (G-i-star) analyses. As a precursor to these analyses, I experimented with three different spatial weight matrixes, queen contiguity, rook contiguity, and 5 nearest neighbors. Figures 11 and 11a show histograms of both the queen and rook contiguity weights (since nearest neighbor weights produced a flat graph it was not included); I determined that a rook spatial weight matrix was the best fit for the data since it most closely resembled a normal distribution and the connectivity map for the queen weights produced undesirable neighbors.

To determine spatial autocorrelation, that is how grouped similar and dissimilar values are to one another, global Moran’s I tests were ran on the variables presented in the exploratory analysis with rook contiguity as the weights matrix. To no surprise, racial demographics produced highly positive values: black = 0.71, Hispanic = 0.61, and white = 0.69. Similarly, average household income, percent of population with less than a high school education, and percent of population with a bachelor’s degree had high positive Moran’s Index values at 0.59, 0.56, and 0.72 respectively. Finally, criminal activity exhibited spatial autocorrelation in its Moran’s I values; Violent crime produced a 0.52 index, property crime produced a 0.37 index and homicides produced a 0.47 index. 311 call rate spatial autocorrelation was less pronounced, with a Moran’s I value of 0.39. Overall, we see spatial autocorrelation high for racial demographics and bachelor’s degrees at around a 0.7 Moran’s I value while income and low education producing slightly lower values and crimes even more. However, violent crimes are systematically more spatially autocorrelated than property crimes and 311 call rates exhibit the lowest spatial autocorrelation of the variables.
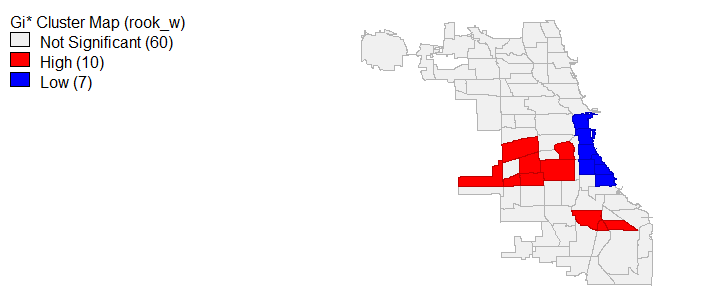
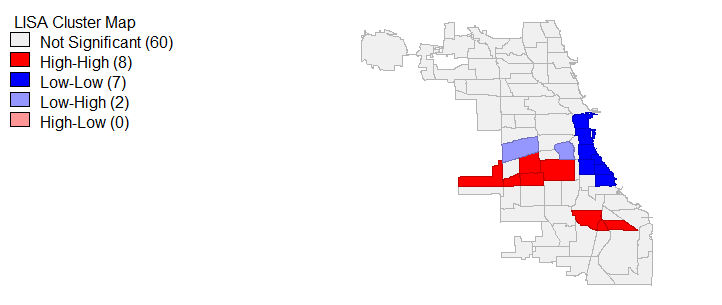
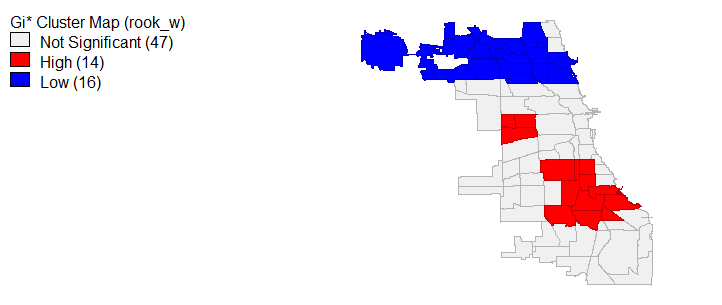
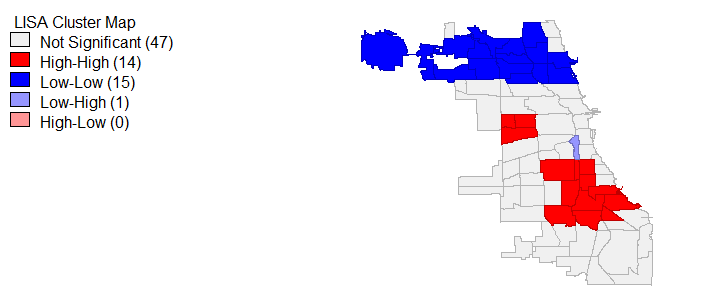
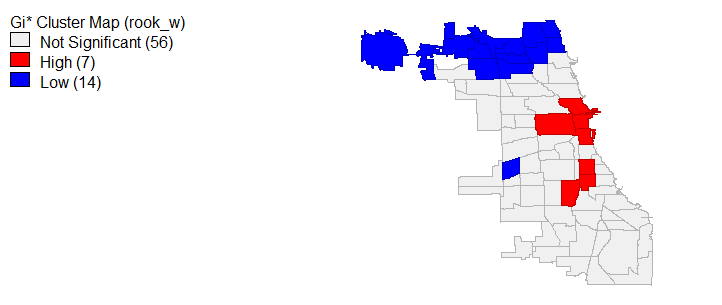
Global Moran’s I is limited, producing results which only determine if the entire spatial study area is autocorrelated; therefore, in order to determine which community areas have spatial autocorrelation and clustering, local Moran’s I and Gi star tests were ran. Beginning with 311 call rates, figure 12 and 12a displays the results of these tests. We can see that statistically significant (p < 0.05) highly similar 311 call values and hot spots are largely present in the west community areas and 3 communities in the south. Meanwhile, dissimilar cold spots exist along the lake in communities like the Loop. For violent and property crimes, the local Moran’s I and Gi star tests show that the most northern communities represent dissimilar and cold locations in terms of crime rates. At the same time, violent and property crime hot spots and similar values are located in the areas we would expect, specifically the south and west for violent crimes (homicides matched these trends) and around the loop and some areas of the south for property crimes, see figures 13 and 14. It’s worth mentioning that average household income, less than high school education and bachelor’s degree local Moran I’s and Gi star’s similar/dissimilar and hot/cold spot values paralleled the findings from the exploratory analysis. In the interest of brevity, I decided not to include those maps.

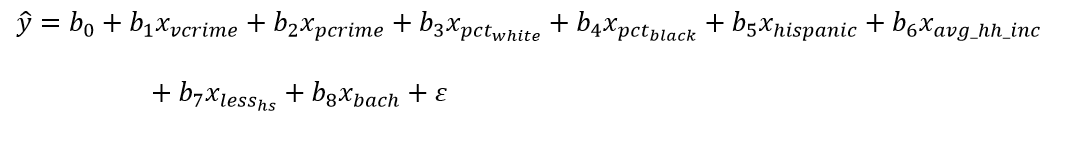
In the final section of this analysis, I assessed the spatial regression models used in this analysis. Model 1 was an OLS regression model with 311 call rates as the dependent variable and the independent variables as violent crime, property crime, white, black, Hispanic, average household income, less than high school education, and bachelor’s degree incorporating the rook contiguity spatial weights matrix .
Based on Model 1’s diagnostics for spatial dependence results in which the Robust LM (error) test was not significant, I determined that a spatial error test would be appropriate this Model 2.
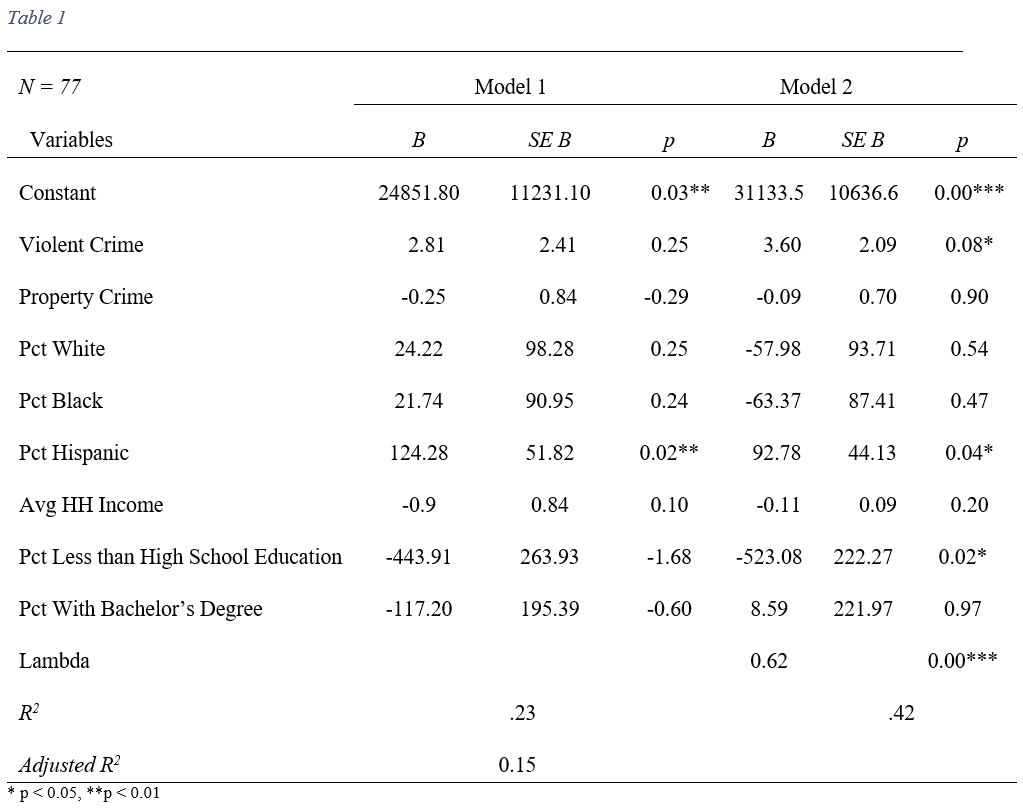
Reviewing Table 1’s regression outputs, there is generally weak evidence that this model is effective in explaining the variation in Chicago’s 311 call rates. In Model 1, the only statistically significant independent variable is percent Hispanic with a positive coefficient of 124.28, suggesting that a larger Hispanic population is predictive of higher 311 call rates. Meanwhile, in the spatial error model we see violent crime, percent Hispanic, and percent with less than a high school education as statistically significant. This model gains more predictive power than Model 1 in its ability to predict how often a community area calls 311. Violent crime and percent Hispanic have positive coefficients while percent less than high school education has a negative coefficient, suggesting that higher crime rates and higher Hispanic populations are associated with greater 311 call rates while lower percentages of the population with less than high school education are associated with 311 call rates. Overall, both models perform poorly in predicting how often a community area calls 311 for local government services. Reviewing the R2 values for the two models, we see a small value for Model 1, 0.23, and nearly an increase of 50% for the spatial error model, 0.42. However, the majority of both models are not statistically significant so caution should be taken when considering the R2 values.
Conclusion
This report endeavored to show that Chicago’s segregation extends past racial and economic and that Chicago’s 2016 crime rates were heavily segregated within the city. Violent crime rates were clustered in areas with low socioeconomic indicators and high minority populations while property crimes were more spread out around the city in respect to racial demographics, but were more heavily centered near the loop which is a high economic area. In an attempt to determine if 311 call rates were impacted by these clustered variables, an OLS regression and a spatial error regression were ran. These models produced little predictive capacity for 311 call rates for the Chicago area in 2016.
There are many logical reasons that 311 call rates are difficult to predict. Namely, calling 311 is not only reflective of a neighborhoods collective efficacy and engagement but also a sign of how much an area trusts the police and the government to solve their problems. Also, 311 calls do not solely originate from residents and can be initiated by strangers, commuters, and tourist. Areas where these values are high or low may impact 311 call rates. 311 calling is also not as common as its 911 counterpart and residents either may not have knowledge about calling 311 or may instead call 911, greatly impacting this specific analysis. Finally, budgetary restrictions may impact how the city of Chicago groups 311 calls and responds to 311 calls.
While this report did not produce a statistically significant model with predictive capabilities, I still believe 311 data provides a great deal of information to cities regarding their neighborhood issues as well as community engagement. Further research should look to join 311 and 911 call data in a spatial model to see if a more well-rounded analysis of total government service calling is impacted by crimes, racial, and socioeconomic factors. Additionally, these results may indicate that the city of Chicago should look into an educational program to ensure residents are aware of the benefits of calling 311 in their neighborhoods.