Having recently started blogging, I realized during my two part YMH post that writing and analysis become much easier when they are topics I enjoy (surprise, surprise right?!). Even more, learning and refining my analytical skills is very fulfilling when combined with topics that I find entertaining. With that in mind, I thought what better data to work with next than World of Warcraft Classic. This is a game I spent much of my childhood playing and I have many, many fond memories of this game. As you can imagine, when Blizzard Entertainment announced Classic Wow, the nostalgic teenager in me could not resist.
Now before the the nerd alarms start going off, let me explain…


… World of Warcraft Classic (‘Classic WoW’) is Blizzard Entertainment’s recreation of the 2004 critically acclaimed and world’s most popular MMORPG game, commonly referred to as World of Warcraft Vanilla1. Part of the allure and success of Classic WoW can be directly attributed to its emphasis of social gameplay. In order to complete end-game content, players must assemble and coordinate massive 25 to 40 person groups through large dungeons or zones, called Raids, within the game, overcoming game mechanics, role requirements and duties, and leadership challenges, all with the reward of powerful end-game epic items, referred to as “loot”. In order to be able to coordinate with 40 other people, in-game organizations, called Guilds, were created for players to socialize and more easily organize towards end-game objectives.
Even though a lot of things have changed since 2004, the need to find and join a good guild is as important as ever. What I found after joining my guild, Buzz, is that the playerbase of classic WoW is essentially the same as 2004, but 15 years older. Thus, most guilds are comprised of mid-career professionals with children, lifestyles, and far more life experiences who played WoW back in 2004.
This story of this idea begins a few months ago when our guild began running into some issues with guild management and loot distribution. See, loot in Classic WoW is extremely sought-after, so much so that there are countless stories of guilds completely disbanding over arguments about loot - a ‘Google’ search of “WoW loot drama” returns 1.9 million results. This led to guilds instituting loot rules or loot systems, such as DKP (Dragon Kill Points), Loot Council, or EPGP (Effort Points/Gear Points). Our guild, for example, decided early on in its formation that EPGP would be our method of loot distribution (I’ll cover the elements of EPGP later in this post). When we began end-game content, we utilized a free-to-use EPGP Discord bot. But as of late, this bot has become unreliable and not easily customizable. It was at this point that one of our members skilled in C# coding decided to write a bot personalized to meet Buzz’s needs.
Now that a few months have elapsed since we deployed our own custom bot, I decided this was a great time to utilize a completely tracked EPGP loot system using R and Tableau. My hope is that by looking into this data, some of our guild members will spend time learning about how useful our bot is but also learn a little more about our guild and loot behavior.
Before we proceed, there are probably a few key terms and gaming concepts I should mention for anyone new to this universe:
Raid zones in Classic WoW allow for up to either 25 players or up to 40 players, depending on the raid. Raids are the main source of EPGP and loot in Classic WoW
EPGP is an accounting and tracking system for loot distribution. Participation in raids and other shared guild objectives accrue Effort Points (EP). Acquiring loot or in-game items increases Gear Points (GP). The ratio of Effort Points to Gear Points determine members priority (PR) for loot. The highest players PR determines who receives the loot: 2
The EPGP Bot tracks, among other things, players attendance to Raids, contributions to guild objectives, items awarded to players, and their EPGP history of accruing points. The Buzz bot functions by interacting with Discords REST API services and user input.
Effort Points, or EP, are pre-determined amounts for Raid participation. For guild objectives and items, average market in-game cost for these items is converted in EP.
Gear Points, or GP, are pre-determined amounts for every item in Classic WoW, primarily based on the items attributes. 2 The exact GP equation for Buzz relies on item value and an items slot value: 2
Our guild primarily raids on Sunday and Tuesday nights after the Classic WoW US servers reset and EP points are awarded for guild objective and item donations on Sundays. As a result, any temporal analysis would not produce particularly insightful findings.
The EPGP bot has gone through multiple iterations, with new changes and features added over time. This may result in slight inconsistencies across the data, though, the core elements of the bot have remained constant.
The EPGP bot has multiple data exporting capabilities. The goal of this blog post is to explore the EPGP data and learn some insights about Buzz.
Setup and data work
There isn’t much work to do here, the EPGP bot’s data is fairly clean outside of a chunk of rows that do not have the correct date assigned to their entries.
pacman::p_load(            ## load libraries at once, this package is a game changer
               tidyverse,
               lubridate,
               ggraph,     ## ggplot
               vroom,      ## improved csv reading and in-line piping during load
               reactable,  ## interactive tables
               plotly)     ## interactive plots

## epgp <- vroom("~/GitHub/kjmagnan1s.github.io/blog_data/buzz_epgp_10.16.20.csv")
## loot <- vroom("~/GitHub/kjmagnan1s.github.io/blog_data/buzz_loot_10.16.20.csv")

t_actions <- vroom("~/GitHub/kjmagnan1s.github.io/blog_data/buzz_transactions_10.21.20.csv") %>%
  ## removing time stamps from date variable
  mutate(TransactionDate = as.Date(TransactionDateTime, format = '%m/%d/%Y')) %>%
  ## reassigned all incorrectly entered dates to August 1st, it was around this time when these records were assigned this date incorrectly and it was resolved.
  mutate(TransactionDate = replace(TransactionDate, TransactionDate == "0001-01-01", "2020-08-01")) %>%
  mutate(Memo = str_remove_all(Memo, c("\\]|\\["))) %>%
  mutate(Type = ifelse(grepl("Roll", Memo), "Roll", "Claim")) %>%
  mutate(Memo = str_remove_all(Memo, c("Claim|Roll"))) %>%
  mutate(Memo = tolower(Memo))


write.csv(t_actions, file = "~/GitHub/kjmagnan1s.github.io/blog_data/buzz_transactions_clean_10.21.20.csv")

glimpse(t_actions)
Rows: 16,020
Columns: 9
$ Id                  <chr> "60646a79-4939-4326-8c97-0c7f5adf7165", "23a3db...
$ TransactionDateTime <chr> "10/21/2020 2:51:16 AM", "10/21/2020 2:51:16 AM...
$ DiscordUserId       <dbl> 1.217641e+17, 1.884660e+17, 1.887478e+17, 7.167...
$ CharacterName       <chr> "Cantuna", "Ganzu", "Azar", "Jaydawg", "Lindo",...
$ TransactionType     <chr> "EpAutomated", "EpAutomated", "EpAutomated", "E...
$ Value               <dbl> 15, 15, 15, 15, 15, 15, 15, 15, 15, 15, 15, 15,...
$ Memo                <chr> "raid end bonus", "raid end bonus", "raid end b...
$ TransactionDate     <date> 2020-10-21, 2020-10-21, 2020-10-21, 2020-10-21...
$ Type                <chr> "Claim", "Claim", "Claim", "Claim", "Claim", "C...
After chatting with our Buzz bot developer, he made a new export function for me to get a much more robust dataset than the ones he programmed for the bot to export (‘epgp’ and ‘loot’ commented out above). With that new export, we have 8 columns and just over 16,000 rows of data. Let’s explain the variables and data below:
DiscordUserID is the ID associated with a user. Because players can play more than one ‘character’, the bot tracks each of those characters EPGP separately but Discord still tracks unique user ID’s. This variable will allow us to track user activity across all their characters.
CharacterName is the in-game character name
TransactionType describes the EPGP value entry type based on in-game actions. The types are start with either a EP (+) or GP (-) classification followed by the following:
EpAutomated: EP awards for participating in raid, automatically assigned based on raid characteristics
EpDecay: Decay is used as an incentive to use the EPGP system and not hoard PR
EpManual: Usually for EP adjustments or awards for in-game guild contributions
GpDecay: Decay is used as an incentive to use the EPGP system and not hoard PR
GpFromGear: GP awards for claiming loot/gear with PR
GpManual: Usually for EP adjustments/corrections
Value is the amount of EP or GP for the transaction
Memo is a short detailed description of the transaction type. Majority of these are automated but manual corrections would be entered here as well
TransactionDateTime and TransactionDate (added my me) are the dates and times of the entries
Type (added by me) is arbitrary and used for one of the charts. I’ll explain more later.
With the data cleaning and explanations out of the way, lets explore the EPGP data with some descriptive analyses in {r} before moving into an interactive Tableau Public dashboard.
Descriptives
Starting with something simple, I wanted to see the most expensive items for GP that were claimed since the start of our new bot:
Some interesting findings in this table. I was really looking to see which character/player claimed the highest GP valued loot. Turns out it was a tie at 301 GP: Phanon for Ashkandiand Banesoul for Staff of the Shadow Flame- which, ironically, both drop from Nefarian, the final boss in Blackwing Lair (BWL). I also found it interesting that most of the items claimed at the top of the list occurred very recently, within the past 2 months, even though about half of the top 10 items in this list are from BWL, which we have been raiding for months. I guess we’ve had some great loot recently!
This is probably a good time to mention that the character I play is Okara (don’t ask, was the name I randomly chose back in Vanilla and I felt I had to keep it in Classic), seen on this list near the top for claiming the Blessed Qiraji Augur Staff for 286 GP.
Lets take this table view and make a plot of the top 20 items claimed, just to look at it visually instead:
ggplotly(
  t_actions %>%
  filter(TransactionType == "GpFromGear") %>%
  distinct(TransactionType, Memo, Value) %>%
  slice_max(order_by = Value, n = 20) %>%
  mutate(Memo = str_remove_all(Memo, "Claim")) %>%
  ggplot(aes(x = fct_reorder(Memo, Value, .desc = TRUE), y = Value, text = paste(
    "<br> Item:", Memo,
    "<br> GP Amount:",Value))) +
  geom_col(position = "dodge") +
  theme(axis.text.x = element_text(angle = 45)) +
    labs(
    title = "Top Loot for GP",
    x = NULL,
    y = "GP Amount"
  ), tooltip = "text"
)
Right so nothing really jumps out at me here. The GP values are ever so slightly skewed to the right, indicating a smooth reduction in GP cost as the items get cheaper. One important note that any WoW player would catch onto, the top 20 list here are all weapons. In the EPGP system, weapons are normally the most sought after item and come with the highest GP values.
The next descriptive type of analysis I wanted to see was overall EP and GP accruals since July. Without getting too technical, I’m interested in finding out how the distribution of EP and GP looks across the guild and if there are any outliers I can detect.
ggplotly(
  t_actions %>%
  select(CharacterName, TransactionType, Type, Memo, Value) %>%
  filter(!(Memo == "20% decay")) %>%
  group_by(CharacterName) %>%
  summarise(EP = sum(Value[TransactionType %in% c("EpAutomated", "EpManual")]),
            GP = sum(Value[TransactionType %in% c("GpFromGear", "GpManual")])) %>%
  gather(EPGP, Value, -CharacterName) %>%
  filter(Value > 10) %>%
  slice_max(order_by = Value, n = 100) %>%
  ggplot(aes(x = fct_reorder(CharacterName, Value, .desc = TRUE), y = Value, fill = EPGP, text = paste(
    CharacterName, "has accrued", Value, EPGP, "points"))) +
  geom_col(position = "dodge") +
  theme(axis.text.x = element_text(angle = 75)) +
    labs(
    title = "Top 100 EPGP Values",
    x = "Character",
    y = "EPGP Amount"
  )
  ,tooltip = "text"
)
Okay so there are quite a few things to point out in this chart. First, in my code I filtered out the ‘decay’ values because I wanted to look at overall EP and GP values and the decay values are arbitrary to promote using the system. Second, we have a lot of guild members in the system and a number of ‘alts’, or secondary characters to a Discord users main character, that accrue EPGP. I removed a portion of characters with very low EPGP values in my code (>10) but there are still clearly a lot of characters with EPGP values. Lastly, a reminder that these charts are interactive, you can zoom, pan, and compare data with your mouse and using the tooltips.
Now with that out of the way, a number of values strike me as intriguing. Baxterwar, one of our guild’s main tanks, has earned one of the highest EPGP values in the guild but also spent the most GP in the guild (mostly on gear to benefit the guild because tanks are so crucial. Thanks, Baxter!) on items like Thunderfury. Damshaman, one of our main character’s alt, has claimed a lot of epic items from raids in a very short time so his EPGP is one of the only negative values I found! Finally, the juxtaposition of Triqueta and HighPriority’s EP and GP is incredibly unique among players. This equates to these players having some of the highest PR in the guild!
Decay
Decay values were, at first, a bit tricky to think about. After talking with some guild members, I have a few ideas on how to view EPGP decay now. My guess is that because decay is out of sight and out of mind after having been announced, it has not changed behavior very much. I think that might change after players see this.
Note: decay is applied flat, at fixed intervals - 20% weekly - to discourage EP hoarding.
ggplotly(
  t_actions %>%
  select(CharacterName, TransactionType, Type, Memo, Value, TransactionDate) %>%
  group_by(CharacterName) %>%
  mutate(Value = abs(Value)) %>%
  summarise(Max_Raid_Date = max(TransactionDate[TransactionType %in% "EpAutomated"]),
            EP_Decay = sum(Value[TransactionType %in% c("EpDecay")]),
            EP_Value = sum(Value[TransactionType %in% c("EpAutomated", "EpManual")])) %>%
  mutate(Ratio = (EP_Decay/EP_Value)) %>%
  filter(Ratio > 0) %>%
  slice_max(order_by = Ratio, n = 75) %>%
  ggplot(aes(x = fct_reorder(CharacterName, Ratio, .desc = TRUE), y = (Ratio), text = paste(
    CharacterName, "has lost", EP_Decay, "EP to Decay. Put differently,", scales::percent(Ratio, accuracy = 0.1), "of their EP has Decayed",
    "<br>Their last raid date was:", Max_Raid_Date))) +
  geom_col(position = "dodge") +
  theme(axis.text.x = element_text(angle = 75)) +
    labs(
    title = "Top 50 Decay Values as a % of EP Earned",
    x = "Character",
    y = "EP Decay/EP Earned"
  ) + scale_y_continuous(labels = scales::percent),
  tooltip = "text"
)
Initially, I began looking at decay across the board and was not very interested with the findings. I quickly realized that raw decay values are nothing more than a representation of a players behavior and engagement in the game. Since it is a flat 20% decay, it mimics overall EPGP values and does not add much to the conversation. However, if we look at decay as a ratio of player behavior metrics, it becomes much more interesting.
For example, the first 10 or so players in this chart have lost almost 100% of the EP they earned through raiding and guild contributions. Many of these players have since quit the guild or have not participated in weekly raids for a few months. As we move down the x-axis, we start coming across more veteran guild members who have obtained most of their ‘best-in-slot’ gear and no longer need loot but continue to raid to help others obtain loot.
Note: These values do not include the commensurate GP decay which is applied at the same amount (20%) and interval (weekly). Therefore, these values do not provide a complete picture of a character’s PR.
items_by_char <-t_actions %>%
  select(CharacterName, TransactionType, Value) %>%
  filter(TransactionType == "GpFromGear") %>%
  count(CharacterName, name = "Items_Claimed_GP", sort=TRUE)

reactable(items_by_char)
ggplotly(
  t_actions %>%
  select(CharacterName, TransactionType, Type, Memo, Value) %>%
  group_by(CharacterName) %>%
  mutate(Value = abs(Value)) %>%
  summarise(EP_Decay = sum(Value[TransactionType %in% "EpDecay"])) %>%
  left_join(items_by_char, by = "CharacterName") %>%
  mutate(Ratio = round(EP_Decay/Items_Claimed_GP, 2)) %>%
  filter(Ratio > 0) %>%
  slice_max(order_by = Ratio, n = 50) %>%
  ggplot(aes(x = fct_reorder(CharacterName, Ratio, .desc = TRUE), y = (Ratio), text = paste(
    CharacterName, "lost", Ratio, "EP to decay per", Items_Claimed_GP, "item(s)"))) +
  geom_col(position = "dodge") +
  theme(axis.text.x = element_text(angle = 75)) +
    labs(
    title = "EP Decay per Item Claimed for GP",
    x = "Character",
    y = "EP Decay/Items Claimed"
  ), tooltip = "text"
)
This chart really speaks to the impact of decay on EPGP. The ratio of EP decay / numbers of items claimed for GP gives you an idea of how the 20% decay impacts your EP values. Now to be clear, I’m not faulting anyone for ‘hoarding’ EP or not claiming items during raids. If a player has all the loot they need and they continue to raid, they are supporting the guild. However, holding a lot of EP and claiming less items seems to have a larger impact because of decay.
Effort Points and Gear Points
Up to this point, we’ve briefly discussed EPGP as a loot distribution system. In order to gain EP, a player needs to either attend guild events or contribute in-game materials to the guild. These in-game materials require a player to spend time gathering the item or spend gold to buy the item and donate it to the guild. We’ve looked at overall EP and GP values and some ways players spend GP, so let’s break down some of the ways players gain EP:
ggplotly(
  t_actions %>%
  filter(TransactionType %in% c("EpAutomated", "EpManual")) %>%
  select(CharacterName, Value, TransactionType) %>%
  group_by(CharacterName, TransactionType) %>%
  summarise(Value = sum(Value)) %>%
  group_by(TransactionType) %>%
  slice_max(order_by = Value,
            n = 20,
            with_ties = TRUE) %>%
  ggplot(aes(x = fct_reorder(CharacterName, Value, .desc = TRUE),
             y = Value,
             fill = TransactionType,
             text = paste(Value, "total EP awarded for", TransactionType))) +
  geom_col(position = "dodge") +
  theme(axis.text.x = element_text(angle = 75)) +
    labs(
    title = "Top EP Earned By Character",
    x = NULL,
    y = "EP Amount"
    ), tooltip = "text"
)
Well now, we’re finally getting into some of the juicy details. The chart above shows the top 20 characters for EpAutomated and EpManual EP types. Now before I go any further, for any of my fellow guild members reading this and feeling #exposed, just a reminder a benefit of EPGP is transparency, this data is available to anyone. Alright, now lets start throwing some shade :D
Our guild’s resident WoW celebrity, Kyx, or better known by her full name SixPacKyx, tops the list at #1 for most EP earned for attending guild raids (remember EpAutomated is awarded for attending raid events) since July. Gintama, aka the weapon hoarder, aka Mr Afk, ironically is in the top 20 for EP earned by raiding and also for EP earned by manual entry, meaning he contributes a lot of resources to the guild. In the prior EPGP Values chart, Gintama clearly had the most EP overall but we now see that a large portion of his EP was a result of guild contributions. The characters in the middle of the pack, from Baxterwar to Arkadus, were also an interesting find. These characters were in the top 20 for both EP earned by raiding and EP earned by donating resources. The remaining 9 characters accrued more EP from contributions than the rest of the guild but did not earn as much EP for raiding.
Rollin’ for Loot 
Alright, the last data point I want to investigate is the EPGP [Roll] function. The [Roll] function is considered a new feature of the bot and represents a change in how characters can obtain loot. The reasoning goes like this: when Blizzard released “Phase 5” content for Classic Wow - essentially a patch or release of new content" - epic items looted during raids which were less desirable to players became useful for the guild. Before Phase 5, we would give out gear which no players wanted to spend GP on by letting players “/roll” for the item. With the release of this Phase 5, items rolled on would now cost GP because, in this phase, epic items can be broken down (‘disenchanted’) into expensive and useful materials. This is probably not worth explaining in anymore length, but this resulting change meant that the guild would begin charge players GP based on the market rate of the material which the epic item disenchanted into. And in order to keep track of this for EPGP accounting, the [Claim] and [Roll] commands were created. (Since this command is new to Phase 5 content, all prior entries of an item will be considered as [Claim]s.)
ggplotly (
  t_actions %>%
  select(TransactionDate, TransactionType, Type, Memo) %>%
  group_by(TransactionDate) %>%
  filter(TransactionType == "GpFromGear") %>%
  summarise(Rolls = sum(Type == "Roll"),
            Items = n()) %>%
  mutate(roll_pop = scales::percent(round(Rolls/(Rolls+Items), 1))) %>%
  ggplot() +
  geom_col(aes(x = TransactionDate, y = Items, text = paste(Items, "items were claimed for GP on", TransactionDate))) +
  geom_point(aes(x = TransactionDate, y = Rolls, text = paste(Rolls, "items were rolled for GP on", TransactionDate,
                                                              "<br>",roll_pop, "of loot went to rolls"))) +
  geom_line(aes(x = TransactionDate, y = Rolls)) +
    labs(
    title =  " 'Roll' Popularity Over Time",
    x = "Raid Date",
    y = "Number of Items Dropped"
    ) +
  scale_x_date(breaks = scales::pretty_breaks(15)),
  tooltip = "text"
)
Well it would appear that ‘Rolls’ have not drastically impacted our EPGP system and they haven’t really changed much over time. I think as more items drop and as more players get geared, we may see loot going to rolls more often but we could also see more alts attending raids and claiming items for GP. It may work itself out. Either way, rolling for loot would seems to hold steady at around 20-30% of total drops per raid night.
There is certainly more analysis I could do with this data, such as looking at DiscordUserID looting behaviors instead of individual characters, visualizing EPGP and PR over time, and there might even be enough statistical power in this data to run some regressions. For now, I’m going to stop and move on to a Tableau Public Dashboard that will facilitate more interaction and visualizations of our guild’s EPGP data. Maybe by the time Phase 6 is released and there are a few more months of data, I can return and run these charts again to see any changes.
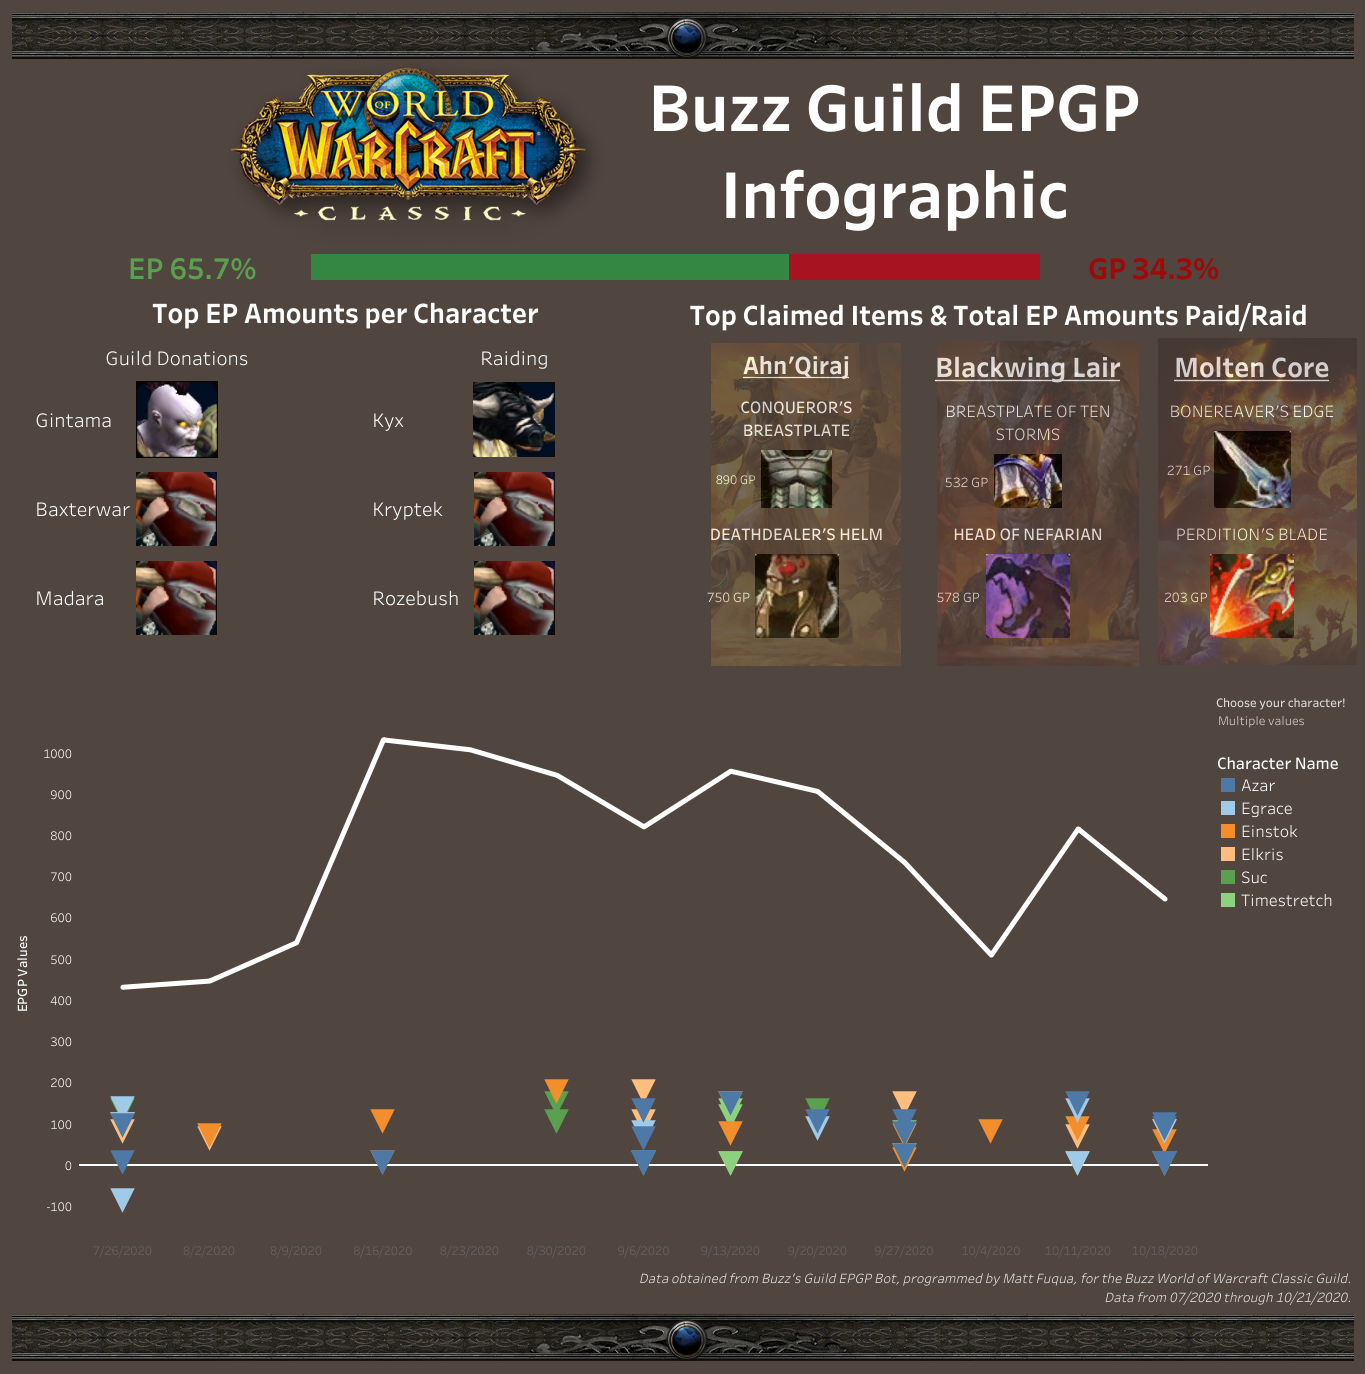
Tableau Public Interactive Infographic
Closing Up
Alright, that’s going to do it for me with this post. I really enjoyed splitting my time between R and Tableau and I’ve learned a ton of really useful but specific information on a video game I play, so there’s that. Ha!
Huge thanks and credit to Matt Fuqua - our Buzz Bot architect. Without the Buzz Bot, I would not have had such a rich and useful dataset for this post! Matt’s work can be found on his github.
1 World of Warcraft Vanilla citations from Wikipedia: https://en.wikipedia.org/wiki/World_of_Warcraft
2 The EPGP language and formulas were written by Matt in his Buzz Bot documentation